
ElcoMaster™ 2.0 fully utilized: From measurement value to a professional inspection report
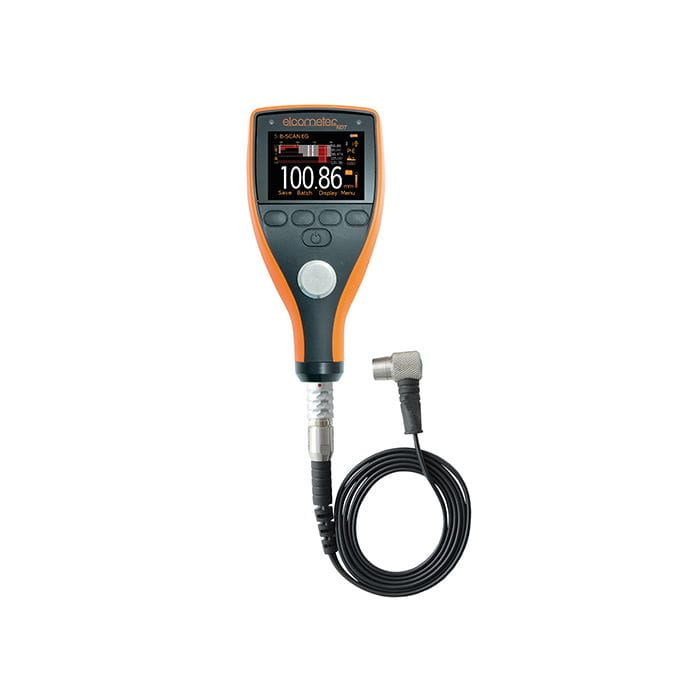
The true strength of the Elcometer 456 Duct Deposit System lies in the combination of a robust measuring device and powerful analysis software. In this guide, we show you how to use ElcoMaster™ 2.0 not only to transfer data, but to create meaningful, standard-compliant inspection reports that provide your customers with maximum transparency.

Why ElcoMaster™ 2.0? Key advantages at a glance
The included software is more than just a data viewer. It is the central tool for documentation, analysis, and reporting of your ventilation inspections according to HVCA TR/19.
📊 Special report for ductwork
Preconfigured “Duct Deposit Report” template shows before/after measurements, calculated deposit thickness, and all statistical key indicators at a glance.
🔗 Flexible data transfer
Import via Bluetooth® (wireless) or USB cable. Data can be transferred live during measurement or later from the device's memory.
🎨 Custom report design
Integrated report designer allows customization of layout, company logo, colors, and content blocks for tailored reports.
📈 Extensive data analysis
Automatically calculates mean, standard deviation, coefficient of variation, min, max, and range for each measurement batch.
Step-by-step: From measuring device to finished report
- Prepare & transfer data:
- Ensure that ElcoMaster™ 2.0 is installed on your PC.
- Switch on the Elcometer 456 and connect it to the PC via Bluetooth® or USB cable.
- Open ElcoMaster™ 2.0 and add your measuring device via the corresponding function (exact steps can be found in the software help menu).
- Select the desired batches in the software window (multi-select with Ctrl key) and click “Download”.
- Create a Duct Deposit Report:
- Navigate to your downloaded measurement data in the project folder.
- Under “Custom Reports”, choose “Select Report” and then the “Duct Deposit Report” template.
- Drag and drop the desired batch into the designated area of the report or double-click it.
- Analyze and customize the report:
- The report opens and displays all 20 individual readings before and after cleaning along with the calculated deposit thickness.
- Below that, all statistical values such as mean, standard deviation, min/max, etc. are listed automatically.
- Using the report designer, you can adapt headers, footers, your logo, additional text fields, or color schemes if needed.
- Export and share the report:
- The finished report can be printed directly from ElcoMaster™ 2.0.
- Or export it as a PDF file for digital archiving and easy email sharing.
- The software also offers a built-in email function.
The Duct Deposit Report: How to read the key indicators
An example report from the software helps you interpret the provided information correctly. Here are the key indicators and what they mean:
| Indicator | Meaning for cleanliness assessment |
|---|---|
| Mean Average | Shows the average deposit thickness across all 20 measurement points. The most important comparison value between before and after. |
| Standard Deviation | Indicates how much the individual readings deviate from the mean value. A high standard deviation after cleaning suggests an uneven cleaning result. |
| Min / Max / Range | Show the lowest and highest measured thickness and the span between them. Reveal local “hotspots” or remaining residues. |
| Coefficient of Variation | The standard deviation expressed as % of the mean. A measure of relative variation—useful for comparing different measurement areas. |
Note: The report also displays threshold overviews (e.g. readings below/above certain µm), which help quickly assess compliance with cleanliness standards.
Ready to get started?
The Elcometer 456 system including ElcoMaster™ 2.0 software is the complete solution for your standard-compliant ventilation inspection.
View complete set in the shopFrequently Asked Questions (FAQ)
1. My PC has no Bluetooth. Can I still transfer data?
Yes, in two ways: 1. Use the included USB cable for a direct connection. 2. Use an optional Bluetooth USB adapter (order number T99920130).
2. Can I combine data from multiple batches in one report?
Yes. In ElcoMaster™ 2.0 you can select multiple batches (e.g. for different floors of a building) and display them in a combined report. Use multi-selection (Ctrl+click) when creating the report.
3. Is the software also compatible with other Elcometer devices?
ElcoMaster™ 2.0 is universal software for many Elcometer measuring devices. However, the special “Duct Deposit Report” template is optimized specifically for the before/after measurements performed with the Elcometer 456 system.
4. Where can I find the full software help?
After installing ElcoMaster™ 2.0, you will find an extensive help file directly in the software (usually accessible via the “Help” menu). All functions are described in detail there.
Conclusion
With ElcoMaster™ 2.0, you can effortlessly turn the raw data from your Elcometer 456 into convincing, standardized inspection reports. The software bridges the gap between field measurement and professional documentation, saves valuable time, and increases the credibility of your work through transparent, data-driven reporting. Invest just a few minutes to familiarize yourself with the import and report functions—it will pay off for every single project.